Picture: Value added statement, or Trade statement; traded (sold/purchased) by the trader.
The Value Added Statement (VAS) show the value added by a company in the past fiscal year as its Contribution to the GDP (Gross Domestic Product/Value) of its Home country, and how it is appropriated.
It is regarded as a part of social responsibility accounting (link).
A Value Added Statement (or Trade statement) is like a Balance sheet for an Income statement.
A Balance sheet: Assets (by mobility) - Liabilities (by owner) = 0
Is a summary of 'All Resources with Financial Attributes'.
Shows a Point in Time
Income Statement
A Value Added Statement: Trades (out) - Trades (in) = 0
Is a summary of 'All Trades with Financial Attributes'.
Shows a Change in Time
Turnover (of resources)
Old: Turnover = Sales revenue ÷ Assets
New: Turnover = Resources (@ customer/stakeholder) ÷ Resources (@ producer/supplier)
Pushing the 'resource value' back in the process is one way to eliminate waste
Trade StatementI prefer to call it Trade Statement' instead of Value Added Statement'.
Why ?
* Bend 'Trade' and it still gives the right associations; a trade, to trade, traders
Compare with "a contribution, to contribute contributors".
* ...
Trade statement (trades, traders)
Output: Products & Service, sold (purchased by Customers)
Input: Products & Service, purchased (sold by Suppliers)
=Gross value
Process: Depreciation, adjustment
=Net value
----
Process: Labour (sold by employees)
Process: Interest (sold by creditors)
Process: Dividend (sold by shareholders)
Process: Taxes (sold by society)
Process: Retained earnings (sold by the organisation/company)
=0 (all trades between all traders)
| Trader | What | 2012 | |||
| Customers | Sales revenue | 192 676 | 100% | ||
| Other | Other income | 24 652 | 13% | ||
| Suppliers | Cost of materials | -122 450 | -64% | ||
| Other upfront expenditures | -22 077 | -11% | Excl. Out+In | ||
| Misc | Depreciation and amortization | -13 135 | -7% | Σ: -59 667 | 100% |
| Employees | Wages, salaries, benefits | -29 503 | -15% | -29 503 | 49% |
| Creditors | Interest expense | -3 957 | -2% | -3 957 | 7% |
| Societies | Taxes, duties | -4 322 | -2% | -4 322 | 7% |
| Shareholders | Dividend (or proposal for) | -1 639 | -1% | -1 639 | 3% |
| The company | Retained earnings | -20 246 | -11% | -20 246 | 34% |
The categorizations are not 100% perfect, but it shows the direction - the vision.
Justice is governed by fair/just trade. What's just is relative to most people.
Good accounting/categorisations/labellings makes it debatable/manageable by a justice system.
A communications framework.
Effectiveness & Efficiency
Effectiveness can be measured from One or All Traders perspective.

Picture: Efficiency = same Output with less Resources. Effective = more correct Output
Effectiveness can be measured as
a) Internal - from our set targets, or
b) External - from the traders targets.

Picture: Analytical framework
Current state
1. Understand the Output; What=Current state,
Understand the Input+Process; Why=Root cause (the Influencing factors)
2. Understand the Function; Output = Process({Input n}). Predict the output
Desired state
3. Understand the Output target; use the Function to get the desired Output
Note: Here Output=both the Product and the Effect (outcome)
Almost there - operations management input output transformation model


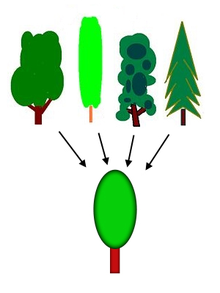
Picture: Development of Product/Process + Fed by a) Vision, or b) Unsolved problems

Picture: SmarterDraw
Control resilience theory (link)
"Once you identify the relevant parameter that controls the system's resilience, you can begin to tackle how to manipulate that resilience--how to enhance resilience or restore resilience"

Comparators. =/≠,</>.
Compared to a Norm/Target/Desired state, Vision/Mission.
AND: all comparisons must be true. OR: none can be false.
Boolean: compare(sum(comparisons))
Set: can be dimensions like {true, false, other}, or measures/numbers
The process of Computation is a (one form of) transformation of measures/numbers.
A process is time based sequence, also called algorithm.
Efficient process=least resources (incl. time)
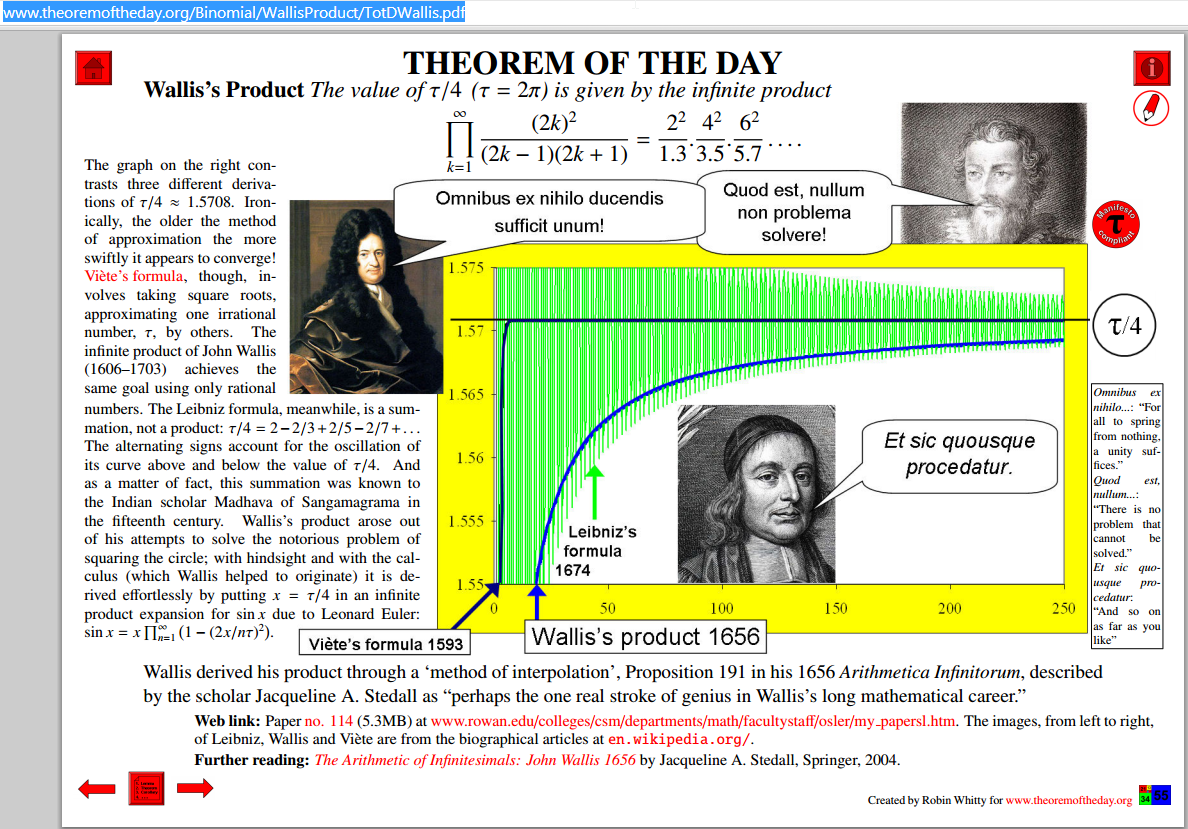
Picture: Same conclusion (different illustration)

Always happy to see when others have come to the same conclusion:

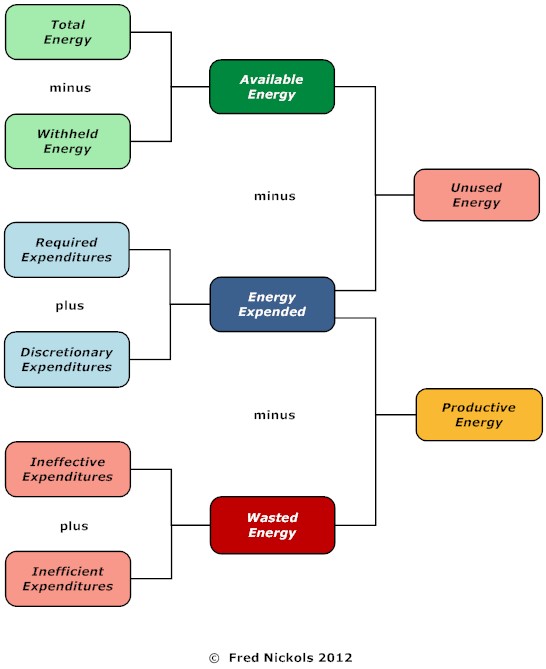
Picture: Source cbsolutions.net
-------
Picture: source

Picture: source
 ,
,