A normal Saturday on internet, published just for fun ;-)
...
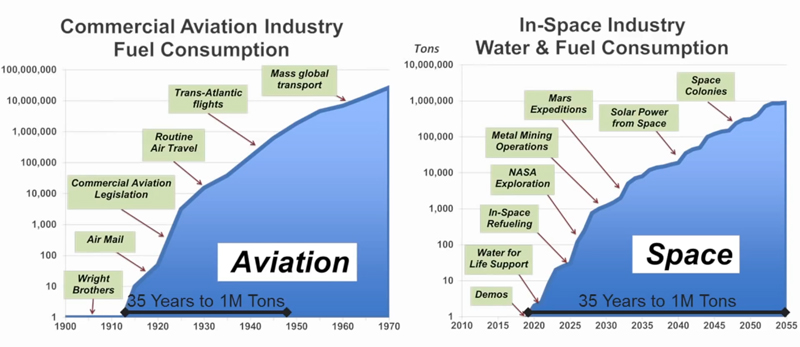
Here is where it started (found via
FutureTimeline, from my
Feedly feed)
 Picture: Search engine for Research&Development papers - built on Machine Learning Technology
Picture: Search word: "Business Model". Similar conclusions (pdf), but not yet there.
Picture: Search engine for Research&Development papers - built on Machine Learning Technology
Picture: Search word: "Business Model". Similar conclusions (pdf), but not yet there.
Picture: Semantic clusters - Dimensions, Measures, ... you understand, right ;-)
Conclusion: We'll get a Linguistic-convergence + a Unified Language either by general (is so good it can be used for several cases), or specific (optimised for specialised case). A function that serves a special purpose. Example; a hammer has a specific function + it include a bi-directional function (do and undo) - which is essential for all progress; political parties, trends, + and -,
Subjective = value by an evaluator precedes the Objective = un-valuated.
Note: You save the Unified Language components in ppt (under download).
Link:
UML (
history),
paper
----------
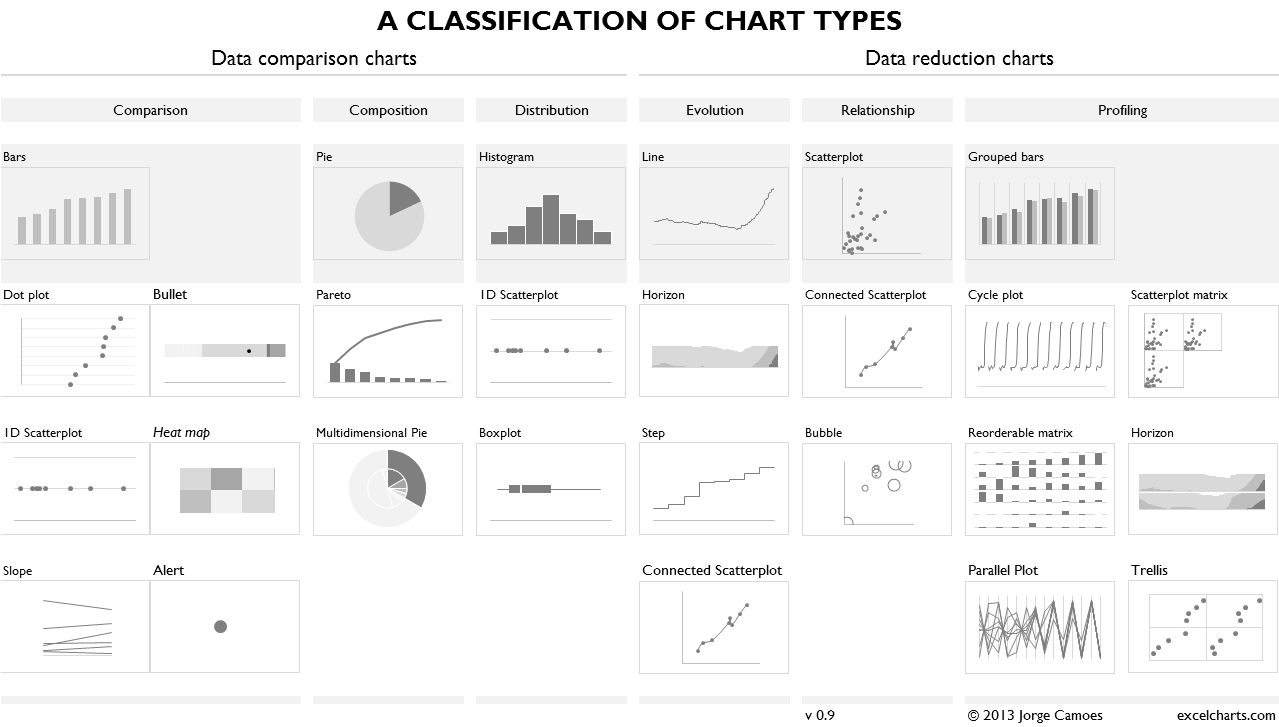 Picture: Shares (continuous/distribution or non-c.), Compares, and Relations (incl. co-relations + to time). Almost right.
Charts can be classified into
1. 'Shares/Parts of a Group': that can be non-continuous (left), or continuous/sequential (-->distribution). Shares always compares, and usually benefits from being ranked, and accumulated (pareto).
A second Group can be Overlayed (continuous or non-continuous); like a Target, or a Years.
2. Relations: means input-output relation; that is algorithmic/processual. The purpose is to visualise a
correlation.
Colors can be used, but are somewhat limited; try do a subtraction (grey75% -grey50% = grey 25%).
------
There are several type of engineers; process (mtrl, money, time, info, ...) -
the fundamental dimensions/measures.
They all process something for a specific purpose. Logistics - the movement, process, efficiently (at low "cost"), effectively (at high revenue).
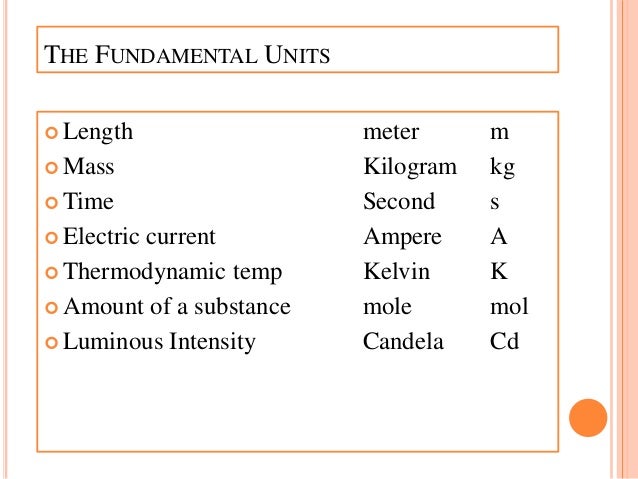
 Picture: Fundamental Physical units (dimensions/measures) - how about Fundamental (business) Value units.
The reason the
Business Model Canvas is wrong, is because it doesn't contain the basic business dimensions and measures.
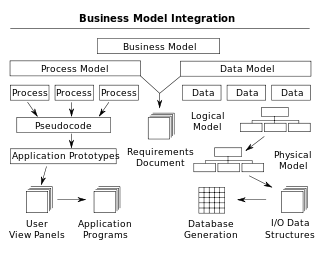 Picture: The Business-model and the Data/information-model must coincide.
It's closer to right than wrong - like the first map-makers of the world - but still not right. For instance Yes relationships are important but not just with the customer . and it's definitely not one of the basic dimensions in a company.
...low battery...