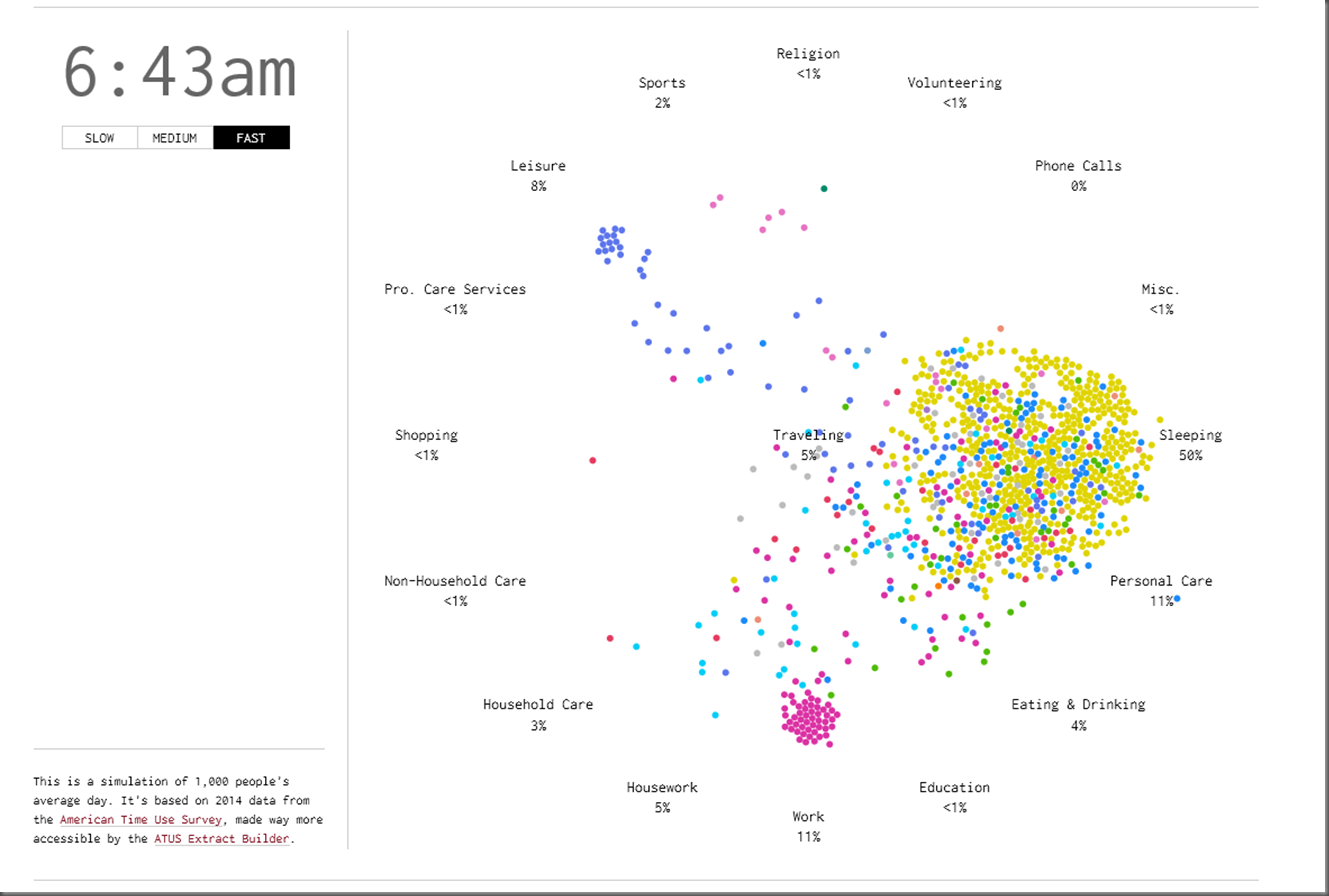
Picture: The flow of activities between functions (cross process). Could also be the output
Source: link
Skills
1. Reprocess: imitation, repeat
2. Discover/Develop: find/make
-----
To change behaviour; Control/Governance
Step1: Habitual behaviour (@ Posterior cingulate cortex)
Trigger --> Behaviour --> Reward
Driven by rewards/result.
Step2: Cognitive control (via Pre frontal cortex)
Trigger --> Awareness --> Compare --> New behaviour (abstain) --> New reward (joy of letting go)
Driven by curiosity/joy of letting go, but Sensitive to stress